Using sys.dm_exec_sql_text() to figure out blocking is sometimes flawed.
2January 29, 2014 by Kenneth Fisher
I frequently rely on joining sys.dm_exec_requests and sys.dm_exec_sql_text() to know what queries are running on a system and when I have a blocking situation I like to look and see what query is running that is blocking everything else. I’ve mentioned recently that you can also use sys.dm_exec_connections.most_recent_sql_handle to see the last batch that was run by a connection. I recently realized that this can be somewhat misleading at times.
-- Setup
CREATE TABLE TranTest (id int not null identity(1,1),
	Numb varchar(30));
CREATE TABLE TranTest2 (id int not null identity(1,1),
	Numb varchar(30));
GO
INSERT INTO TranTest VALUES ('One');
INSERT INTO TranTest2 VALUES ('One');
GO
-- Connection 1
BEGIN TRANSACTION

INSERT INTO TranTest VALUES ('Two');
GO
INSERT INTO TranTest2 VALUES ('Two');
GO

INSERT INTO TranTest VALUES ('Three');
INSERT INTO TranTest VALUES ('Four');
GO
-- Connection 2
SELECT * FROM TranTest2;
Connection 2 is now blocked. Let’s take a look an output of sys.dm_exec_requests and sys.dm_exec_sql_text.
SELECT session_id, blocking_session_id, text
FROM sys.dm_exec_requests
CROSS APPLY sys.dm_exec_sql_text(sql_handle)
WHERE session_id > 50
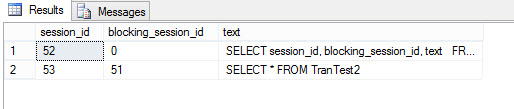
First we can exclude session_id 52 since that is the session I’m running the requests query from. That leaves session 53 which is being blocked by session 51. And session 51 isn’t in the list at all. So in order to get the sql_handle we have to go to sys.dm_exec_connections.most_recent_sql_handle.
SELECT session_id, text
FROM sys.dm_exec_connections
CROSS APPLY sys.dm_exec_sql_text(most_recent_sql_handle)
WHERE session_id = 51

As a reminder the query being blocked is this:
SELECT * FROM TranTest2
And based on the results from sql_text the blocking query is:
INSERT INTO TranTest VALUES ('Three')
INSERT INTO TranTest VALUES ('Four')
Which have nothing to do with each other. The reason for the blocking is the command:
INSERT INTO TranTest2 VALUES ('Two')
GO
Which didn’t show up because it’s in a previous batch within the same transaction. In order to see more information we would either need a piece of monitoring software (Idera’s Diagnostic Manager or Red Gate’s SQL Monitor for example) or need to look into sys.dm_tran_locks. I have more detail on looking into sys.dm_tran_locks in this post.


[…] (session 2 from above) is blocked by session 51 (session 1 from above). You will also notice that session 51 is not on the list from sys.dm_exec_requests. This is simply because the request has ended even though the transaction is still […]
[…] Blocking is just part of life I’m afraid. Because we have locks (and yes we have to have them, and no, NOLOCK doesn’t avoid them) we will have blocking. Typically it’s going to be very brief and you won’t even notice it. But sometimes you get a query or two blocked for long enough to cause a problem. Even more rarely you end up with a long chain of blocked sessions. Session 100, 101, and 102 are blocked by 67 which is blocked by 82, which is blocked by … Well, you get the idea. It can be very difficult to scan through all of those blocked sessions to find the root cause. That one or two session(s) that are actually causing the problem. So to that end I’ve written the following query. Among other things it will return any lead blockers, how many sessions are actually being blocked by it, and the total amount of time those sessions have been waiting. It will also give you the last piece of code run by the that particular session. Although be aware that won’t always tell you exactly what code caused the blocking. […]