
Yet one more quick and easy performance tuning setting
1June 1, 2015 by Kenneth Fisher
I blogged in the past about two simple commands that can be a big help in performance tuning SET STATISTICS IO and SET STATISTICS TIME. Well I learned a new one recently. Client Statistics Unfortunately there is no t-sql command to turn it on but it’s not terribly difficult.
Query->Include Client Statistics or Shft-Alt-S
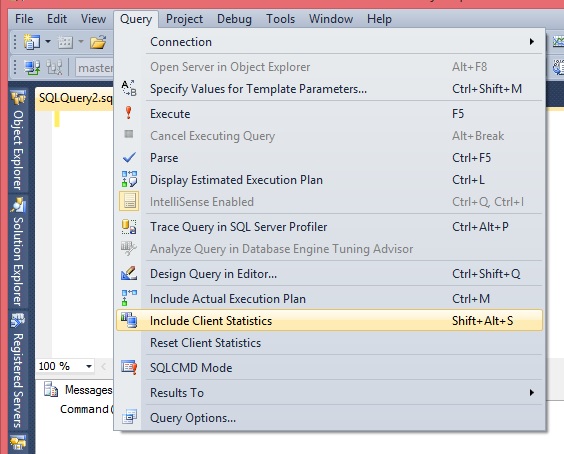
Or hit this button on the tool bar

Note: This only turns Client Statistics on for the current query window.
Given that I’m lumping it with the SET STATISTICS commands it should be fairly obvious that it returns statistical information useful for tuning a query.
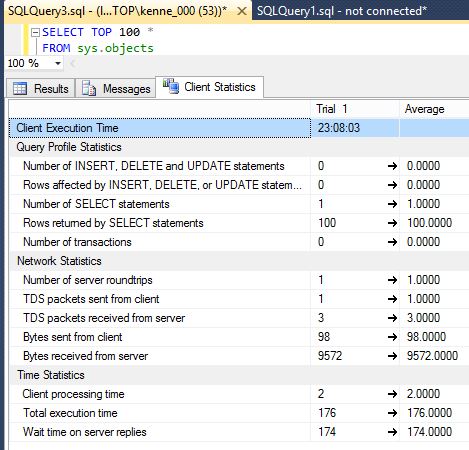
Specifically it returns
Query Statistics
When the execution occurred, the number of rows affected by a write (UPDATE, INSERT, DELETE) and the number of rows affected by a read (SELECT) and the number of statements for each and the total number of transactions.
Network Statistics
Number of server roundtrips and the number of packets and bytes, sent and received.
Time Statistics
Client processing time, total time and wait time on server replies. Note that is not the same as the wait time in say sys.dm_exec_requests. This is how long the client was waiting on a response from the server.
I’m sure you will agree that is fairly useful information, but it gets so much better.
Each time you run a query it adds a new column of statistics. Well, technically not a query but the entire execution even if it’s multiple batches. As I’m sure you expect there is a limit to the number of columns that it can display. After 10 executions they start rolling off the end so you only get the most recent 10 executions. But that’s still pretty helpful when trying to tune a query. Particularly given that each execution displays what has increased or decreased since the last execution and there is a column with the averages at the end.
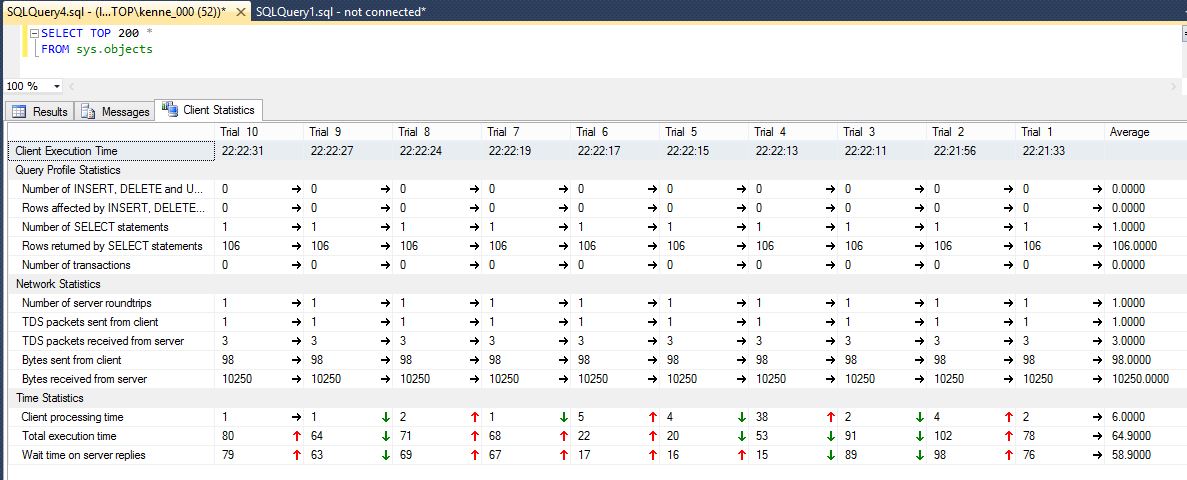
Obviously this isn’t enough information to do anything with on its own but when combined with the STATISTICS queries and the query plan this can give you a nice history of what you’ve been up to.


[…] The First 100 Days of New Leadership 7 Ways the Most Productive People See Life Differently Karen’s Rules for Being Lazy Persisting SQL Server Index-Usage Statistics with MERGE SQL Server Quickie #25 – the Transaction Isolation Level Read Committed SQL Server 2016 Always Encrypted Yet one more quick and easy performance tuning setting […]